Matthew Nicoll, Cypher Consulting
Summary of Computer Graphics Experience
- over a period of 2 years, made extensive use of the NCAR graphics
package at the Institute of Ocean Sciences, for producing 3-D surface
plots and contour plots for representing shelf wave model states and
data fields.
- wrote a hydrographic plot program for a KONGSBERG photographic flat
bed plotter.
- have written numerous X,Y data plot programs using the basic CALCOMP
routines.
- researched the state of graphics standards (in 1986), selected GKS,
and subsequently supervised a project which made use of GKS.
- have written interactive graphics programs using the CA-DISSPLA
package, and have supervised programmers on projects involving DISSPLA.
- have worked with the following graphics terminals:
TEKTRONIX 4014, Visual 550, Selanar, TEKTRONIX 4100 and 4200 series,
DEC VT240/241.
- designed and implemented an interactive graphics system on a VAX 785
and TEKTRONIX 4205, using DISSPLA + direct terminal control, using
pixel graphics for satellite images, building dynamic multi-surface,
multi-segment images.
- have written graphics programs, interactive and non-interactive,
using CA_GKS on a VAX and GSS-GKS on a PC
- designed and wrote a system in AutoLisp to plot data onto drawings
in AutoCad, on a PC.
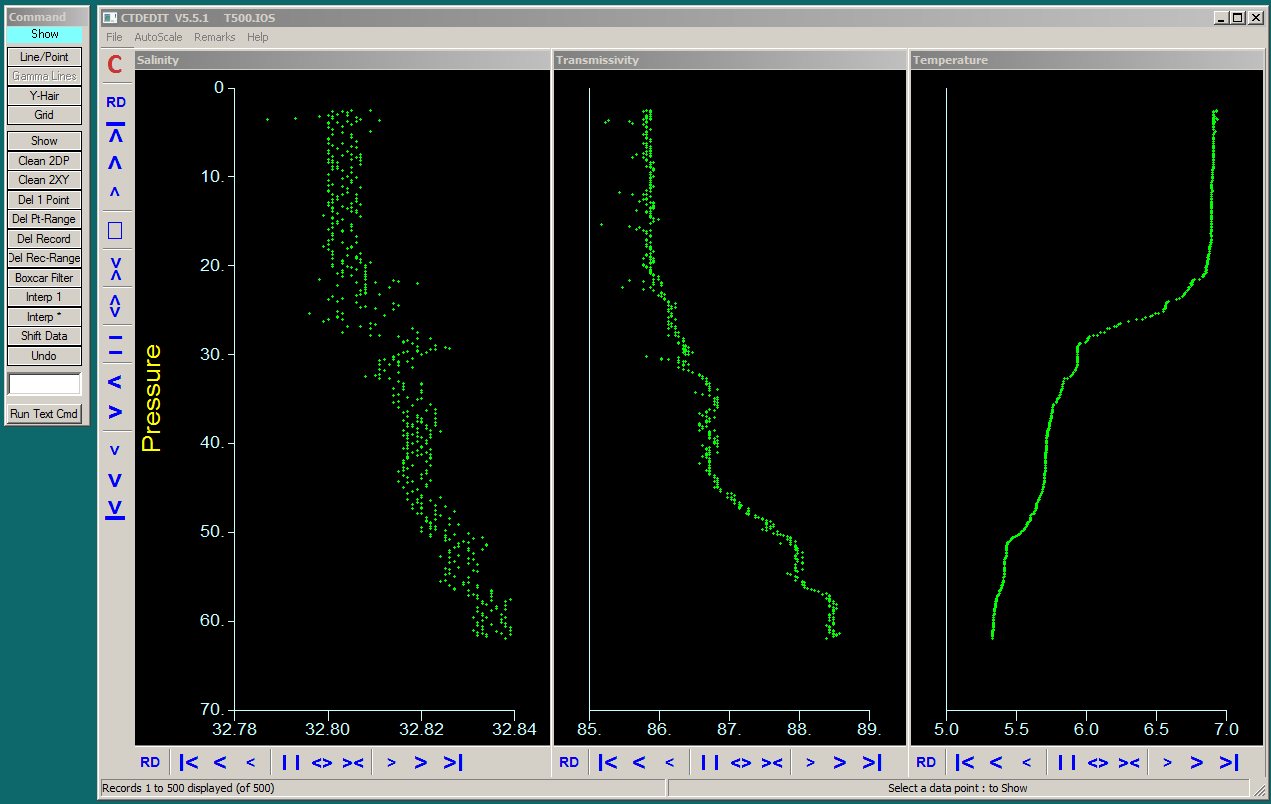
- ported a GKS interactive graphical oceanographic data editor to Windows,
using Oxford Scientific Software GKS, and Digital Visual Fortran.
Created a Graphical
User Interface for the program, using both DVF QuickWin and
GKS features. (See sample.)
- Converted the above graphical editor program to
Intel Visual Fortran, using the
Winteracter graphics library.
(See sample)
This program is still in use, in 2024.
- developed a VBA user interface for defining complex details
for plotting economic series, with multiple series per plot and
multiple plots per chart. Chart definitions are stored in XML files,
which are read by a Fortran/Winteracter program which produces the
charts in Windows graphics (EMF) metafiles, for inclusion in web
pages and Microsoft applications.
- wrote an interactive Windows/Fortran90/Winteracter program to
geographically display
the locations of oceanographic data files, with
coastline, bathymetry and data range profile options.
The user can select files for inclusion
in file lists, zoom/unzoom, access data from a selected file, and launch
other programs to edit or produce plots of the data in a selected file.
(sample)
- ported a number of Fortran programs from Plot88 graphics to
Winteracter
graphics for running under Windows. (sample)
- wrote a Visual Basic 6 program to produce HPGL files of time-series plots, suitable for inclusion in MS-Word and Excel.
Core Home Page |
Contact